
LiveScore
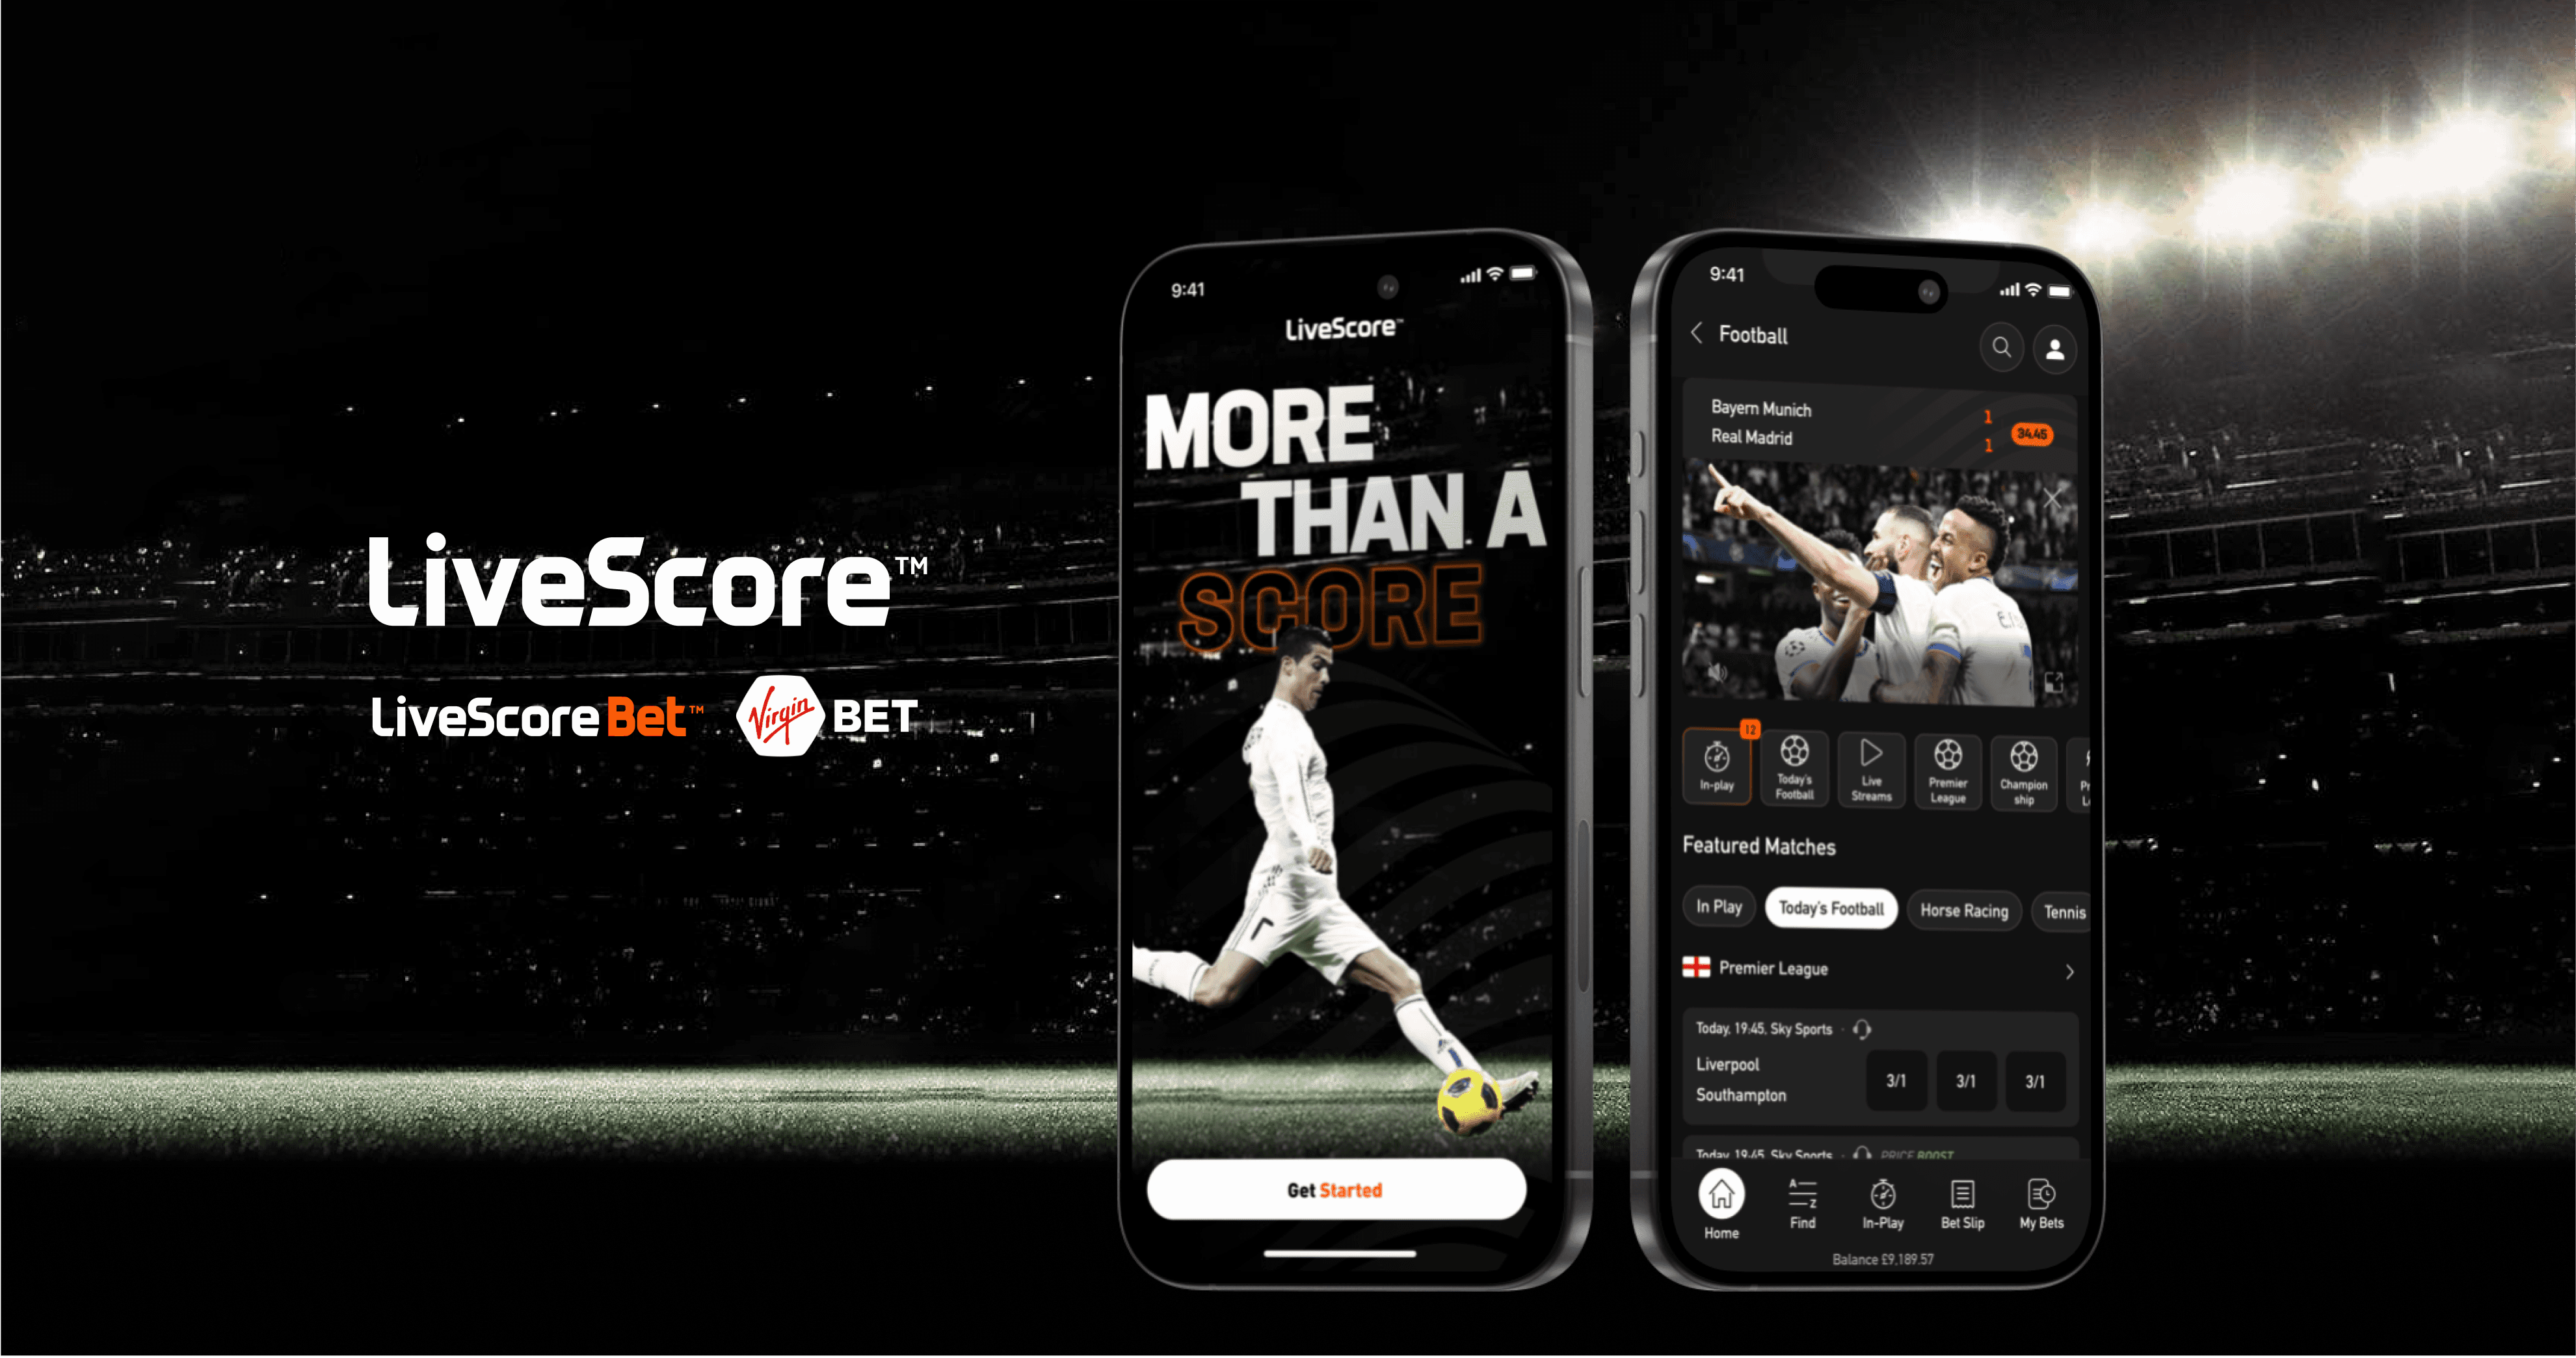
Product Design for app and web at LiveScore Group, designing features within a team of 10 for a user base of +50 million across the product ecosystem consisting of three apps: LiveScore Media, LiveScore Bet and Virgin Bet.
Completion Date
March 2024
Category
Product Design, UI/UX across LiveScore Groups' three-product ecosystem
Sector
Sports
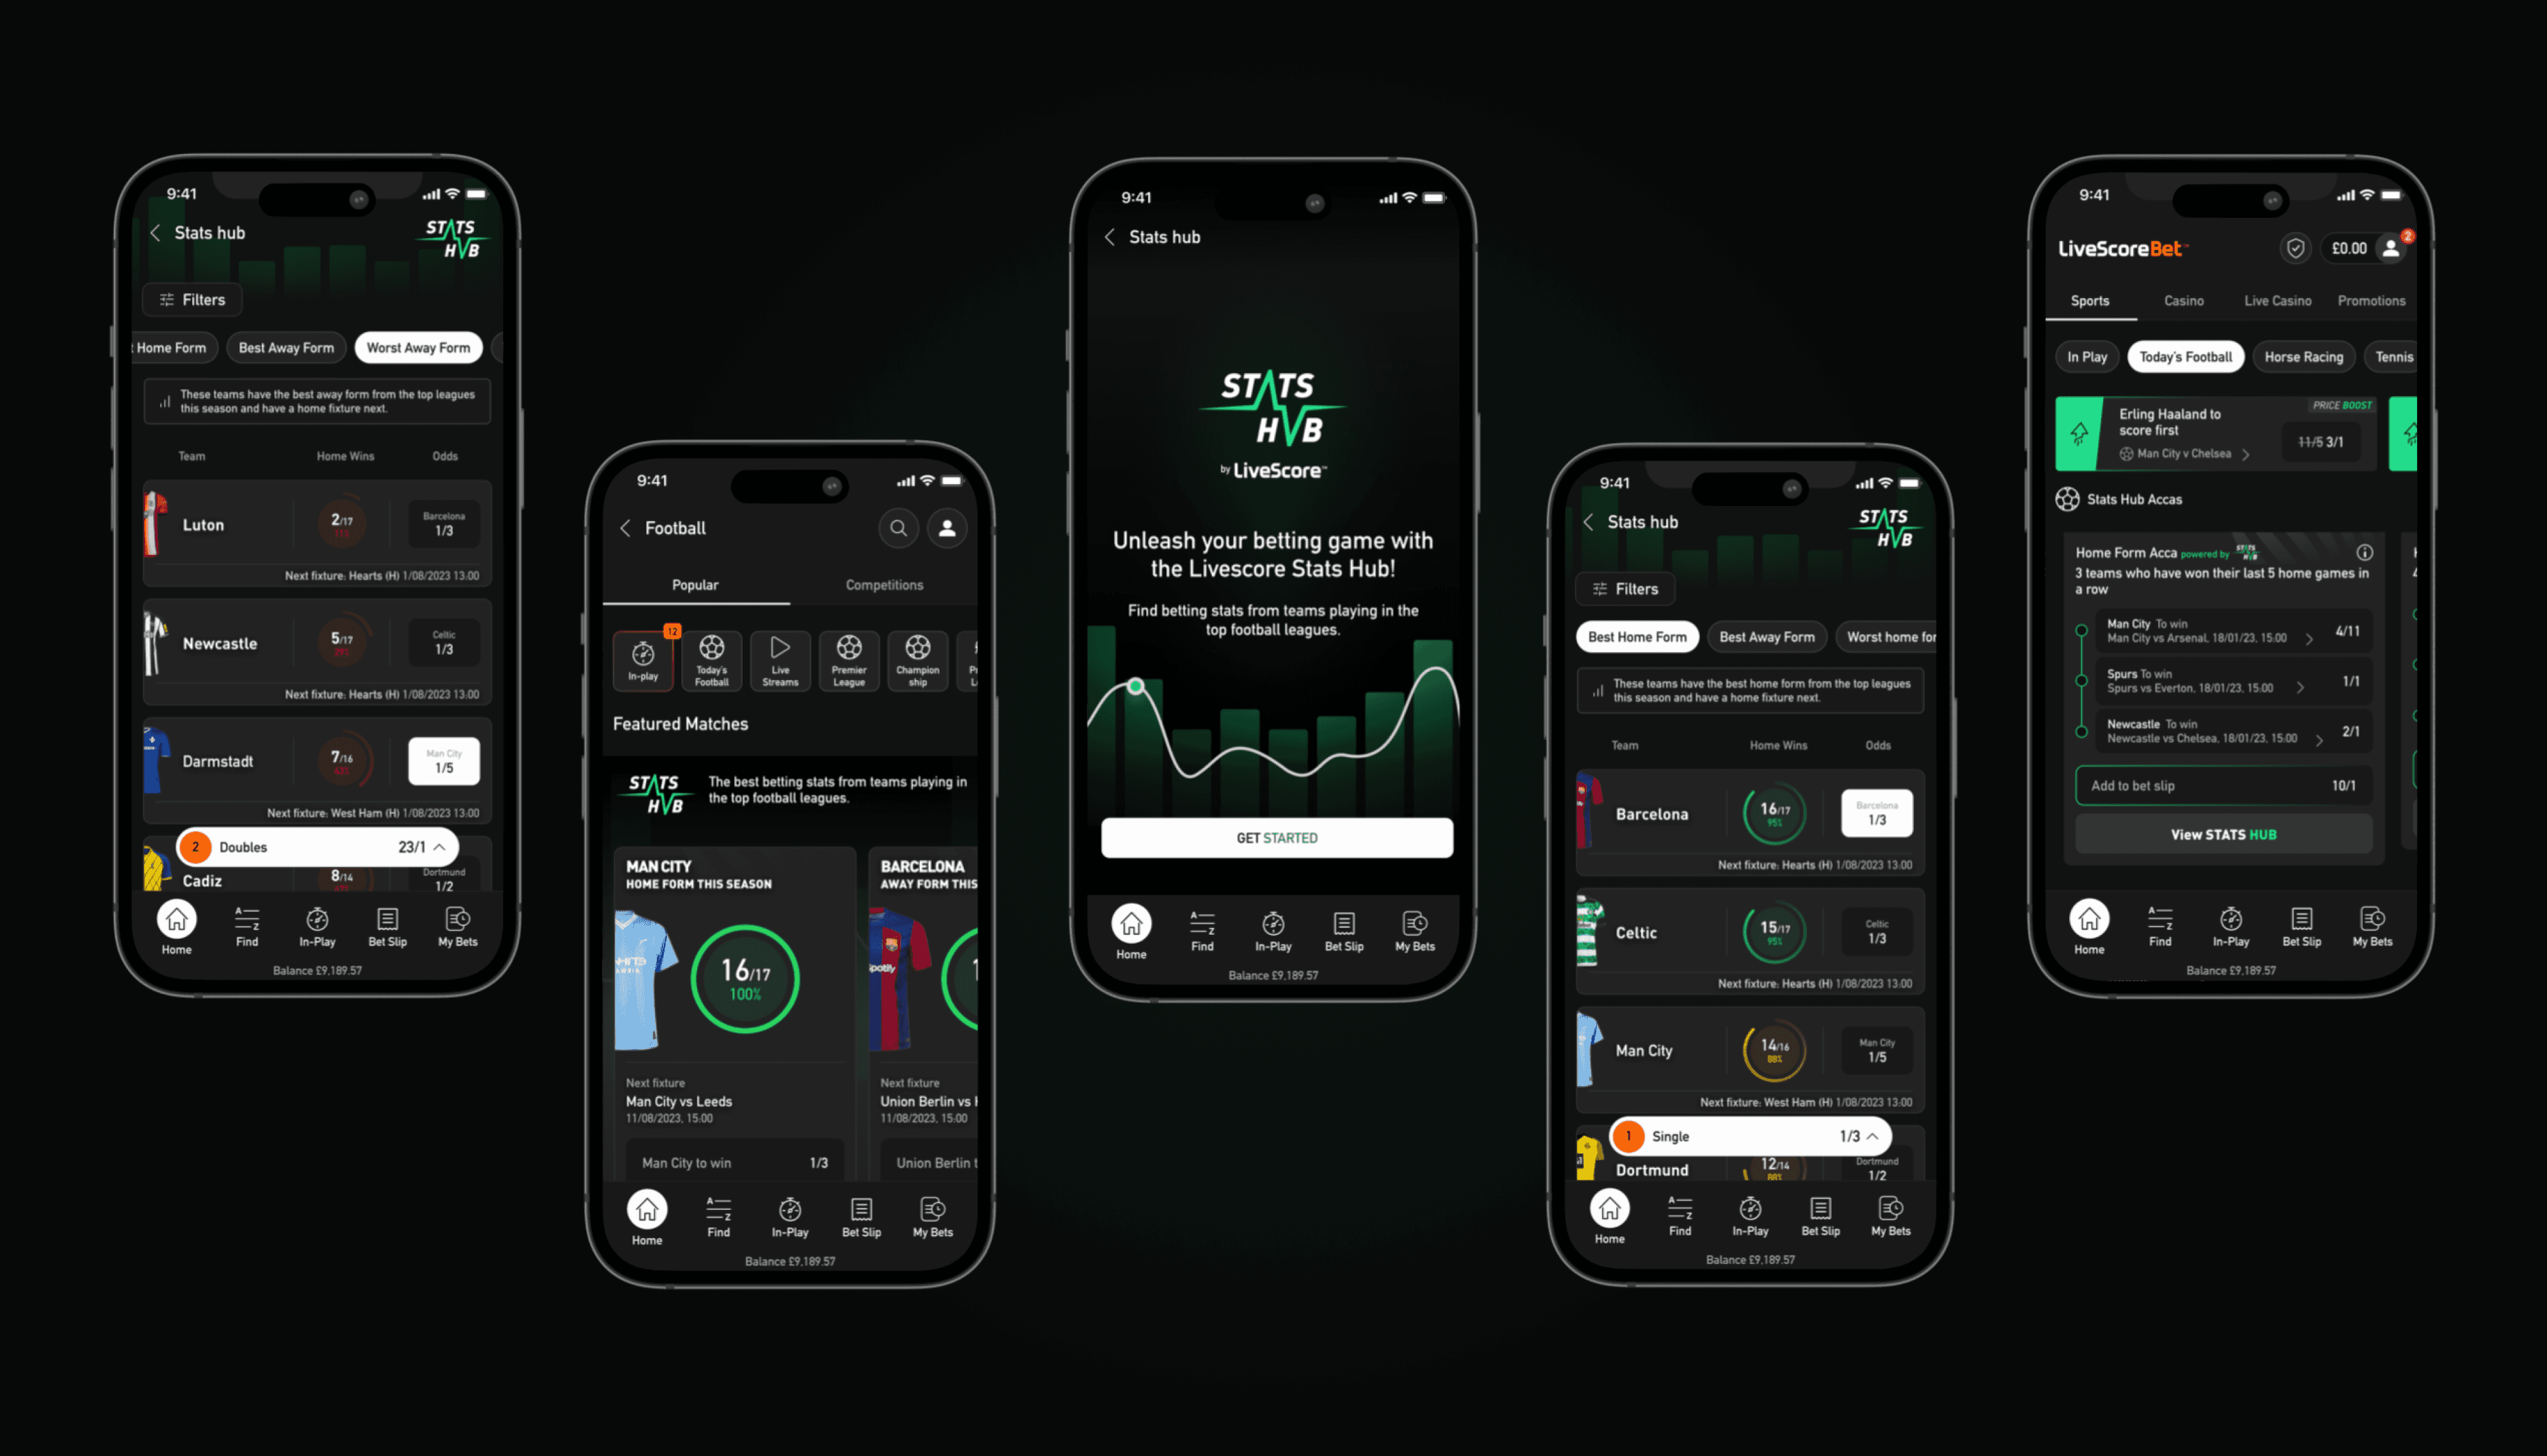
Harnessing LiveScore’s ecosystem to revolutionise the sports betting industry with 'Stats Hub'.
Out with the double diamond. In with the Infinity Loop
Our unorthodox but necessary process
Our process for designing Stats Hub purposefully veered away from the traditional double diamond. We wanted to build and learn fast, really fast. In order to do so, we sketched, designed, and prototype tested, quickly and often.
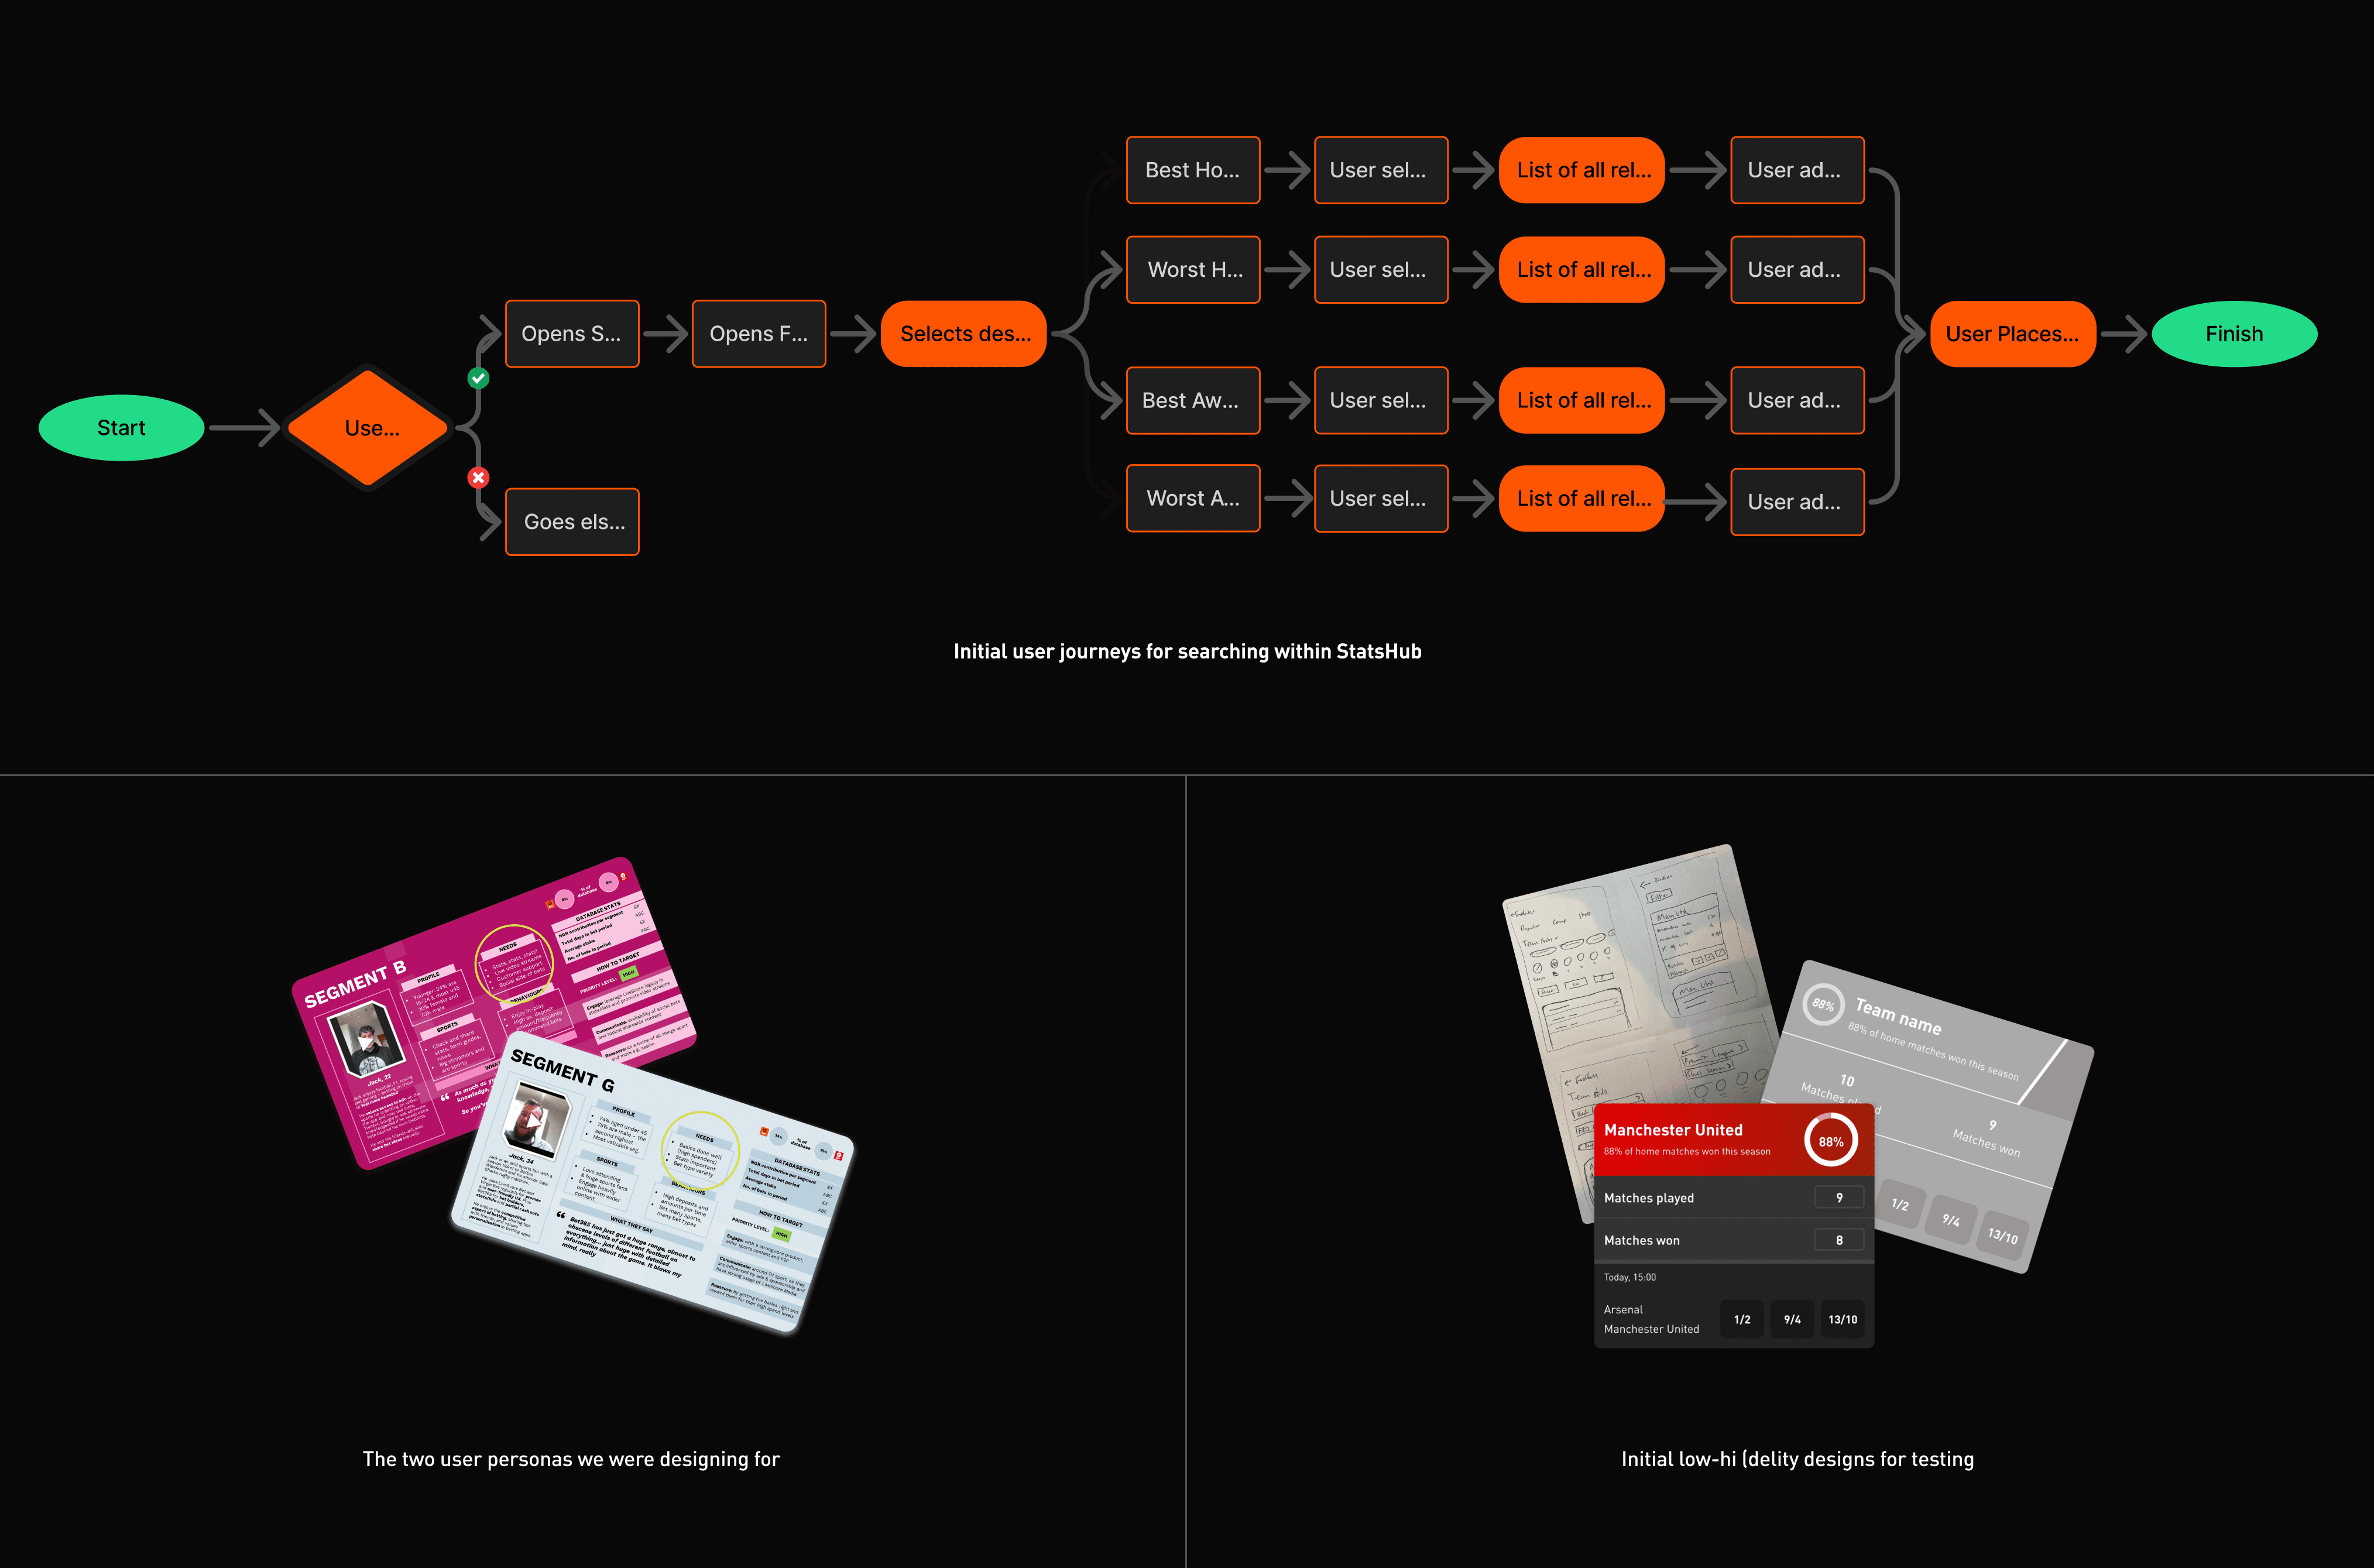
Why Stats Hub was only targeted at 2/8 of our user personas
LiveScore had many user personas however, only two of these personas were undertaking thorough statistical analysis prior to placing bets. Therefore we focused our efforts on designing specifically for these two user personas.
Initial designs, initial challenges
We sketched some ideas and mocked them up quickly for prototype testing. We had to allow for multiple filters whilst trying to surface as much as possible whilst also conscious to avoid choice paralysis, a challenge we welcomed!

"Never settle for the first solution without thorough exploration" - Kate Parker (Head of Design)
We tested the designs against our assumptions and the results were very positive.
10/10 users understood the concept and were likely or very likely to use it
9/10 could find the feature and use the filtering system effectively.
9/10 users made sense of the stats.
Although testing had validated the designs, we knew we could improve them and we did.
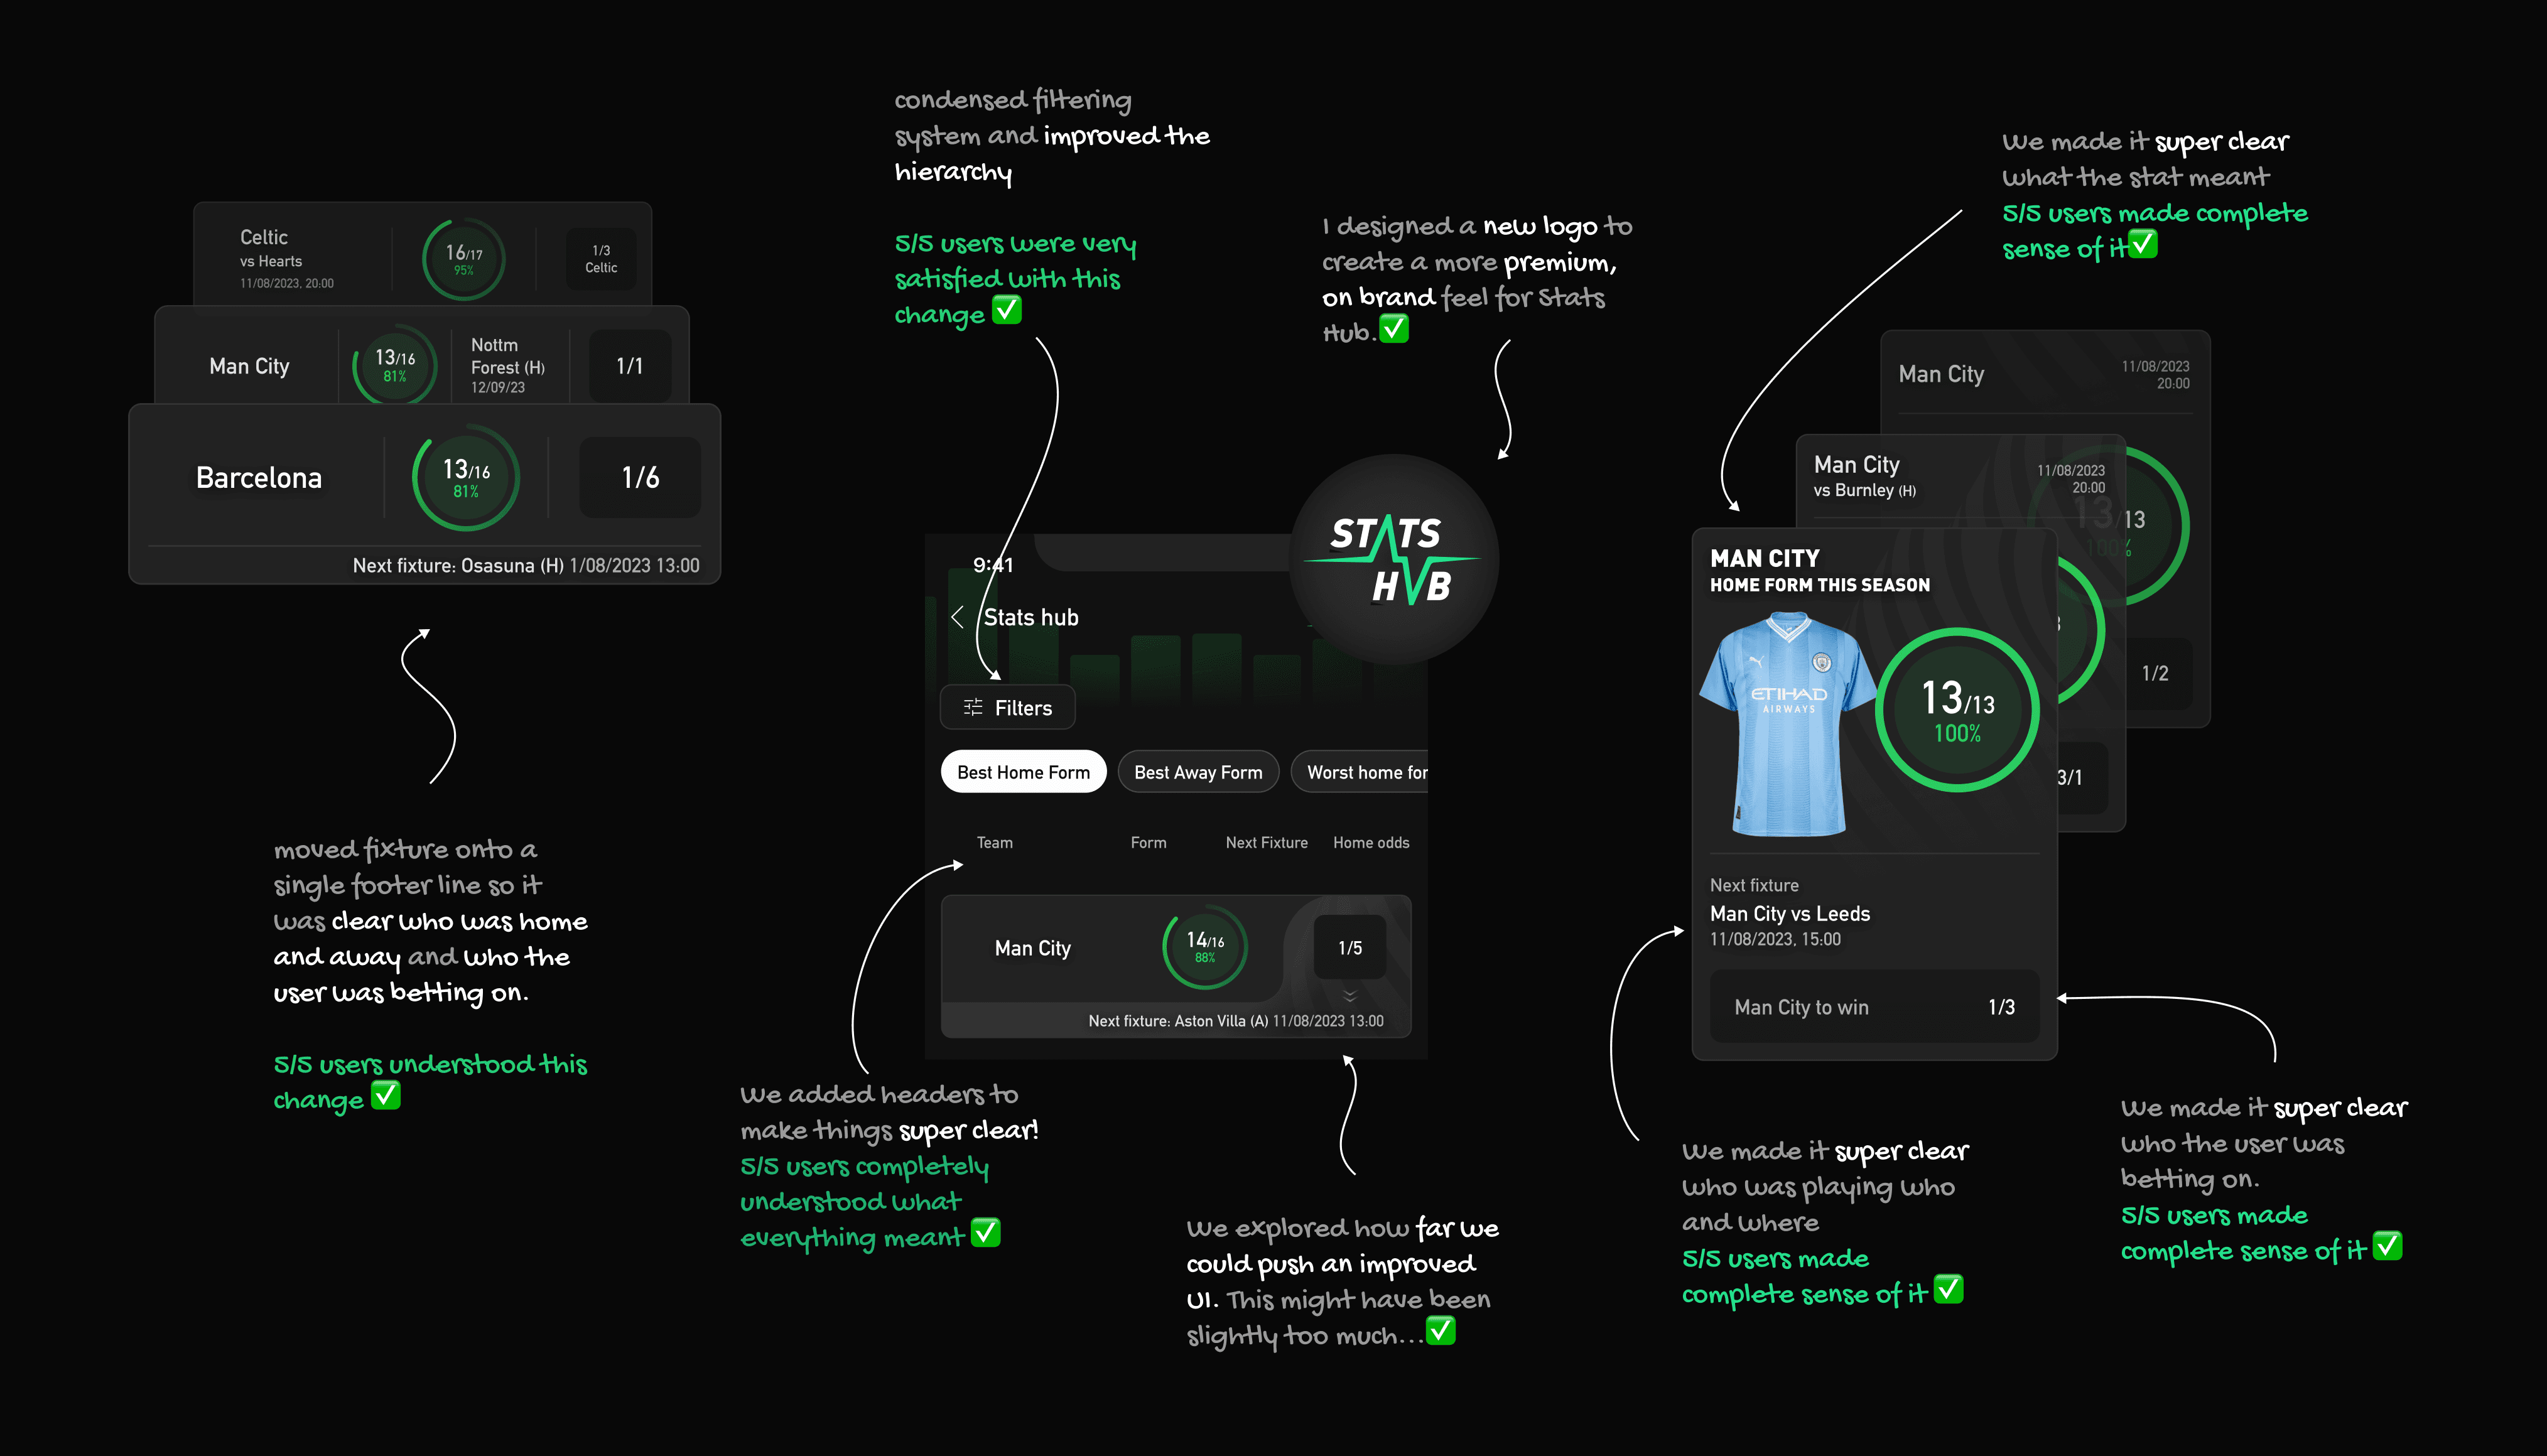
We improved the designs to enhance usability and user satisfaction. I explored multiple different UI's, experimenting with hierarchy contrast and sizing until I found the perfect balance that allowed for the greatest number of cards on the screen whilst easily showcasing the most important information first. Bringing more visibility to the stat whilst scanning as well as a single clear CTA were the main improvements I made.
Furthermore, I redesigned the filtering system putting the majority of filters behind a single button but giving more prominence to the most important elements such as the market pill rail. This also gave more attention to the stat rings and CTA's of the event cards with the intention to increase engagement.
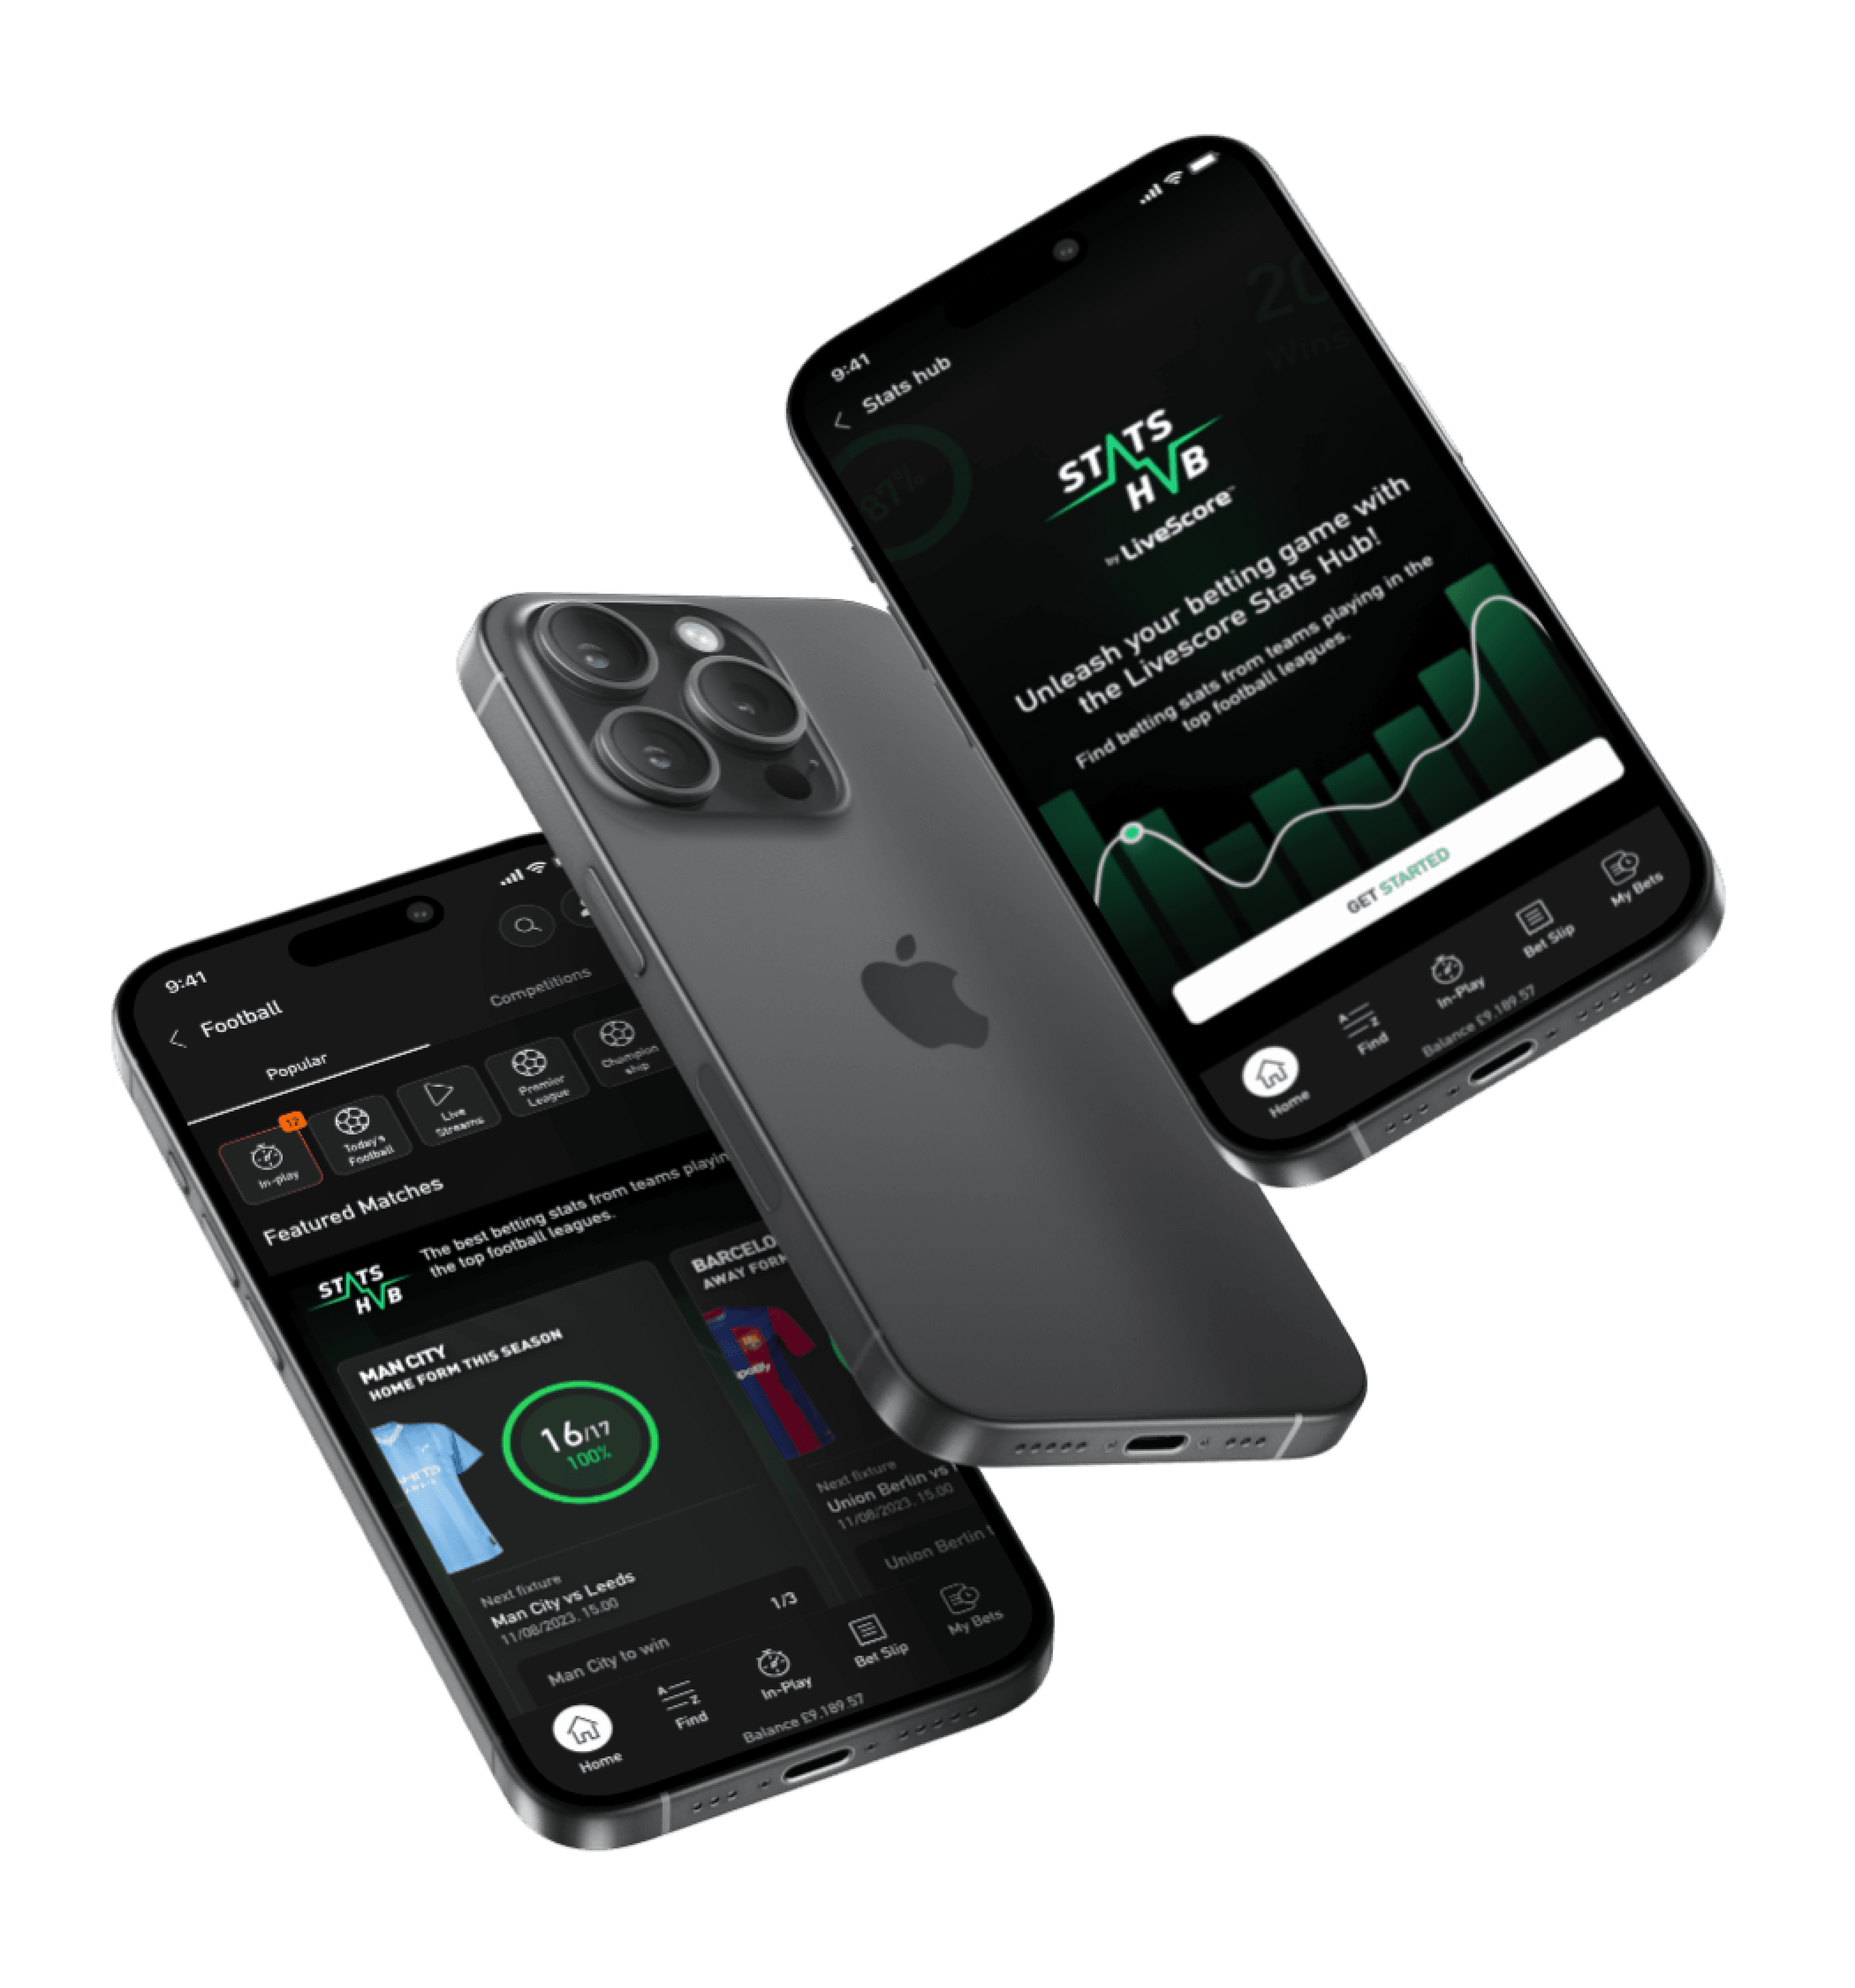
To bring more of a modern, premium feel to the feature I redesigned the UI, introduced kits and branded Stats Hub with a new logo (worked on by myself and George, Lead Designer).
We also introduced a home page coupon as an additional entry point to improve education and engagement of the feature. This went through a few rounds of testing as initially users got confused by the stat and who was playing home or away.

If at first you don't succeed, test and iterate again
Against our assumptions, the new designs tested poorly
We tested on a further 5 bettors. The updates to the filtering system were received really positively. However, the fixture and the updated stat within the main event coupon completely confused users. The home page coupon also confused users with them not knowing who was home and away marking the design as dysfunctional…back to the white board we went…
Updating them once more
Huddling around the whiteboard once more, we redesigned the home screen coupon to be idiot-proof by adding some essential copy and adjusting the layout. We did the same with the event card bringing the fixture onto a single event line as well as introducing a contextualised banner for each market.
5/5 users made complete sense of the updated designs
After three prototype tests and a lot of iterations we were happy and so were our users.
The new designs tested really well. 5/5 users made complete sense of the updates to the home screen coupon and the event card. I then went through the designs one final time looking for any inconsistencies or necessary tweaks before handing them over to the developers for tech analysis.
The developer bottleneck and what happened next
Stats Hub was a really fantastic feature to work on. It was an opportunity to bring something new to the sports betting world and as a team, we designed something really valuable. It was an example of the design process looking like an infinity loop, drawing upon different tools and methods at different stages of the… loop. It was also an example of where even though the users and the data is validating a design, it doesn't mean the design is as impactful as it can be. In this case, we could improve things, a lot! The downside of this project was the developer bottleneck we faced whereby the delivery time was pushed back months.
It is likely to be built by December 2024 when the team can start tracking its progress against our success metrics and begin making informed updates. I look forward to catching up with the team in the future and to see how Stats Hub performed and what needed changing.
Thank you for reading!
Deliverables
Working closely with multiple teams to design, test and iterate new product features harnessing the power of the LiveScore group ecosystem.
Design Team
Kate Parker, George Trinick, James Wilcocks, Toby Downham
